

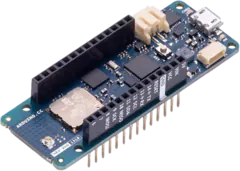
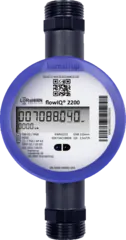
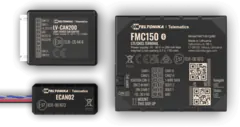
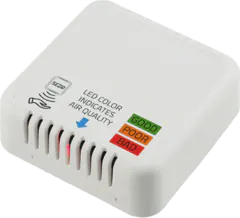
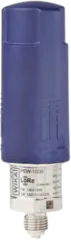
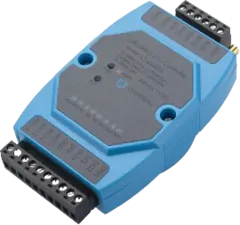
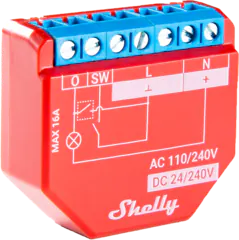
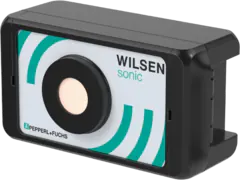
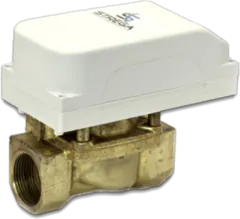
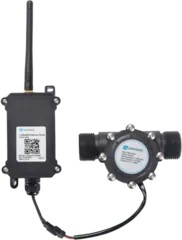
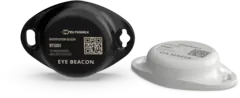
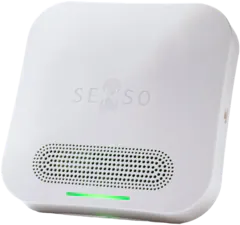
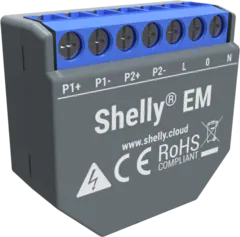
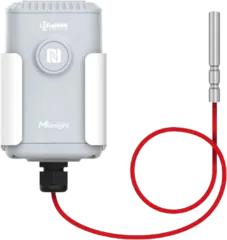
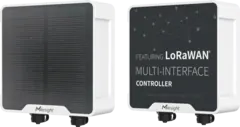
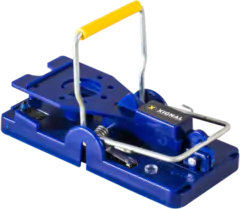
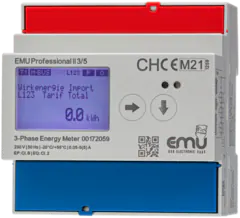
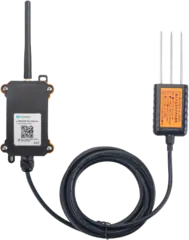
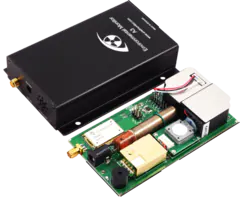
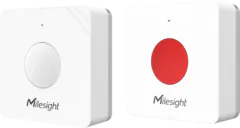
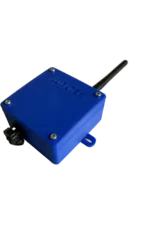
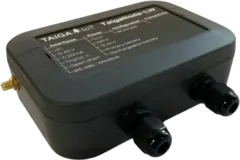
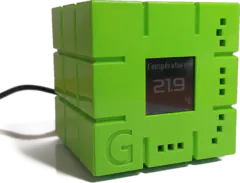
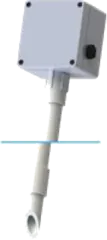
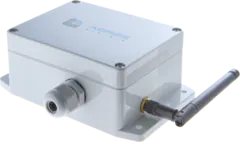
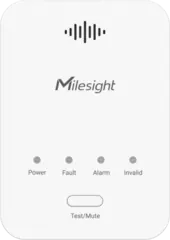
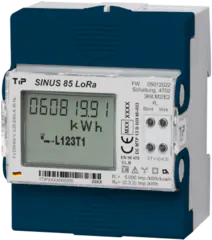
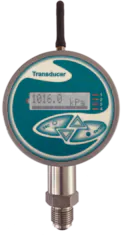
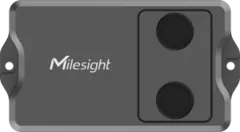
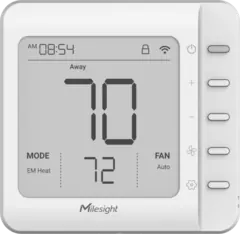
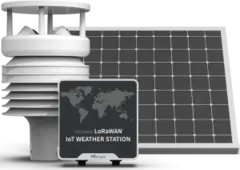
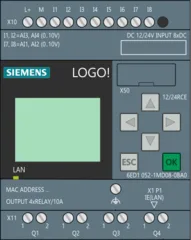
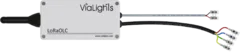
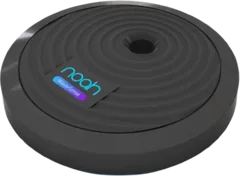
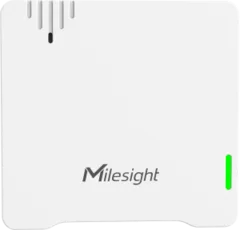
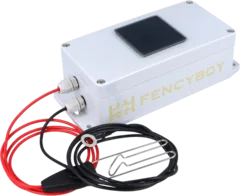

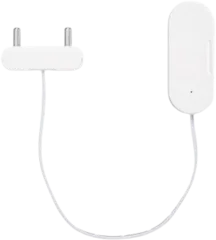
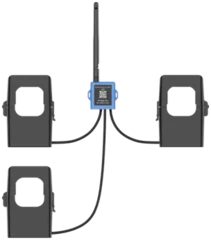
Hardware manufacturers
Bring your device to the Marketplace
Share what it sends and work with the team on a simple integration sheet.
Talk to usPlatform · Marketplace
Payload decoders, variables, uplinks and downlinks, already solved for devices from many manufacturers, for the network servers they travel through and for the tools around them. Install the integration and start from data, not from a datasheet.
The problem
The same temperature arrives in a different format from every manufacturer, and someone has to decode each one.
01 67D6 0002 68 52int16 LE · × 0.1temperature21.4°CCB F608 A201 9E 01 7F FFint16 BE · ÷ 100temperature22.1°C{"temperature":{"tC":41.3,"tF":106.3}}JSON · field tCtemperature41.3°CWhat an integration brings
One hardware model, packaged once: how to read its messages, what it measures and how to talk back. Then reused in every project.
Worked exampleTemperature & humidity sensorLoRaWAN
A few bytes optimised for air time. The decoder turns them into variables, so nobody reads the datasheet byte by byte.
Which measurements the device exposes, with units and structure, so applications never guess field names.
Sampling intervals, alarm thresholds or operating modes, built into the right downlink message.
Where it applies, a dashboard comes with the device, so data is visible from the first message.
Worked example from the Stop Integrating IoT Devices from Scratch article
Device integrations
Pick a job to see what its hardware reports and a few models already in the catalogue.
Industry
Cities
Agriculture
Buildings
Energy and water
Assets and fleets
Five models per job, from a much longer list. All of them are in the device catalogue
Network servers and connectivity
The connectivity plugin decides how a message arrives, the integration what it means. Change the network server and nothing else changes.
Configure the application ID and the console gives the webhook its endpoint, token and JSON format. One application, all its devices.
Connect a LORIOT application through its HTTP webhook. Devices and buckets are created by device type.
The same pattern for ChirpStack networks. Device integrations run on any of the three.
Auto-provisioning, connection timeout alerts and downlinks written as JSON, encoded into 8 bytes.
Anything that can POST JSON: third party devices, cloud APIs or your own programs.
It all lands in the same console as devices on IOTMP, MQTT or HTTP. See Device Connectivity.
Plugins
A rule engine, a notebook or a monitoring stack is an install away, instead of another server to host and wire up.
Development
Node-RED next to the platform, with Thinger.io nodes. Jupyter, RStudio and VS Code install the same way.
Monitoring
Grafana opens from the console over device data, alongside Prometheus and Alertmanager.
Infrastructure and more
A container registry, file transfer and an MCP server.
How it works
Nothing to deploy by hand: the Marketplace is part of the console.
Step 1: In the console
The Marketplace sits next to devices and dashboards, with a readme and requirements per integration.
Step 2: One click
Installing creates the product: auto-provisioning, decoder, buckets, a dashboard and the downlinks.
Step 3: First message
Point the network server at the platform. Each device provisions itself, already decoded.
Missing a device?
Manufacturers bring their hardware, project teams ask for the model they need. Either way, it is built once and listed for everyone.
Hardware manufacturers
Share what it sends and work with the team on a simple integration sheet.
Talk to usProject teams
Tell us which model is missing, and how it reaches the platform.
Request an integrationyour-device/plugin.jsonProduct profileREADME.mdMarketplace pageassets/Product imageNow starts from data
Teams with their own hardware can also write custom plugins, following the Marketplace documentation
Next step
Look up your hardware in the Marketplace and see what is already solved for it. Missing a model? Tell us, and it may be the next one in the catalogue.