

Case study
An office that learns how it is used
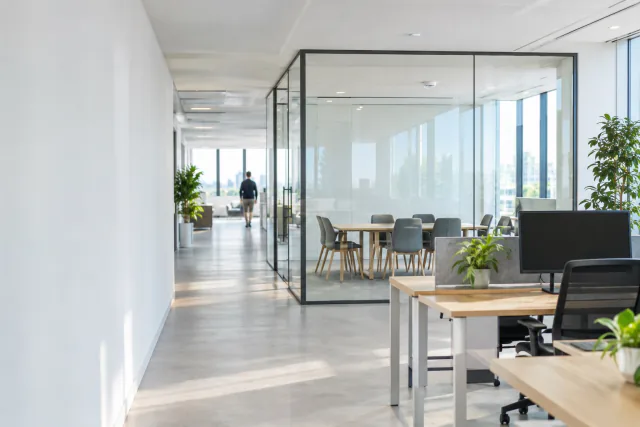
A corporate office where facility teams see how meeting rooms, chairs, washrooms, corridors and elevators are really used, and evolve the space accordingly, with anonymized tracking keeping every person behind the data private.
- Meeting room occupancy
- Chair availability
- Washroom usage
- Corridor and elevator traffic
- Client
- Corporate office
- Sector
- Workplace analytics
- Connectivity
- MQTT and HTTP
- Hardware
- Presence sensors and counters
The setting
The modern office is a living environment
An office floor is one of the most expensive assets a company operates, and one of the least understood. Teams grow and shrink, some rooms are always fought over while others sit empty, and the people responsible for the space usually decide on impressions.
Monitoring how the facilities are used shows how each space actually works, so it can perform better and cost less to run.
Without data
How offices are usually run
- Cleaning rounds
- On a fixed schedule
- Climate and lighting
- On a fixed calendar
- Refurbishments
- On intuition
- Privacy
- Tracking is anonymized: the picture is of the office, never of the people in it
The deployment
What the office reveals
Four families of variables cover the life of the floor: occupancy of meeting rooms, availability of chairs, use of washrooms, and traffic in corridors and elevators. The sheet below redraws them as the facility team sees them, stream by stream.
Meeting room occupancy
FIG. 01Presence sensing in every meeting room draws a live map of the floor: which rooms are in use, which sit free and which stay chronically underused.
ROOM STATUS · IN USE / FREE / UNDERUSED · PER ROOM HISTORY
Chair availability
FIG. 02The platform follows chair availability seat by seat across shared areas: which seats are taken right now and which are free.
SEAT STATE · FREE / TAKEN · SHARED AREAS
Washroom usage
FIG. 03Washroom visits are counted through the day, and the counts feed the cleaning plan: crews are dispatched by actual use instead of fixed rounds.
VISITS / HOUR · CLEANING PLAN INPUT
Corridor traffic
FIG. 04Counters at key corridor points profile foot traffic through the day: where people actually move and when the flows peak.
FOOTFALL / HOUR · GATE COUNTS · ANONYMOUS
Elevator traffic
FIG. 05The same tracking covers the elevators, completing the circulation picture: when vertical traffic runs busiest and how it shifts along the day.
ELEVATOR TRAFFIC / HOUR · UP / DOWN FLOWS
Dynamics of use
FIG. 06Every stream lands in one usage record that reveals the dynamics of use of the facilities: the raw material for every space decision.
HOUR x DAY MATRIX · USAGE HISTORY
Results
From usage data to action plans
The usage record turns into action plans for cleaning, heating and lighting, and shows how meeting rooms are really used when the organization needs to grow. Space performance goes up while operating costs come down.
For the company
From impressions to usage data
Cleaning
Before: Fixed roundsNow: Where traffic actually went
Climate and light
Before: Fixed calendarNow: Real occupancy
Meeting rooms
Before: Sized on intuitionNow: Sized to the teams' habits
Under the hood
How the deployment is built
The deployment runs on Thinger.io. Presence sensors and people counters register as devices and report over standard protocols such as MQTT or HTTP. Data buckets keep the full usage history, dashboards give facility teams live floor maps, and alarms and endpoints connect the data to cleaning, climate and lighting.
Only counts and presence states reach the platform, never identities, and another floor or building means more devices, not new software.
Keep reading
More success stories

Office air purifiers on automatic pilot
Purifier fleets report state and filter wear, so service follows actual condition.
Read the case study
Arvum: agronomy know-how delivered as a service
Growers irrigate by soil profile data, guided through AG-ZOOM, the firm's own platform.
Read the case study
MAPHI: fresh food grown in Antarctica
A hydroponic module at Marambio Base grows fresh greens at -30 °C outside.
Read the case studyNext step
Measure how your building really works
Office space utilization is one smart building deployment on Thinger.io. If you want your own workplace, campus or building portfolio to report how it is used, and to act on it, we can help you get there.