
Case study
UPM and UC3M: hydrology measured sensor by sensor
Research groups at Universidad Politecnica de Madrid and Universidad Carlos III de Madrid built their own dense NB-IoT network, so soil moisture and water levels are recorded through every storm, in near real time, on battery power alone.
- Dense 50 x 50 m sensor grid
- Storm events in near real time
- Battery-only field deployment
- Peer-reviewed and open access
- Client
- UPM and UC3M
- Sector
- Hydrology research
- Location
- Madrid, Spain
- Connectivity
- NB-IoT
- Hardware
- ESP32 NB-IoT nodes
- Deployment
- Thinger.io Cloud
Who they are
Hydrologists and computer scientists
The project joins hydrologists from the Universidad Politecnica de Madrid, who study what a catchment does during and right after a storm, with sensor network and data fusion specialists from the Universidad Carlos III de Madrid.
Their starting point: hydrology needs high-quality field data, and traditional networks are sparse, poorly connected and short on battery. So the team designed, calibrated and deployed its own low-cost sensors.
The project
Two universities, one network
- Hydrology, UPM
- CEIGRAM, the Complex Systems Group and the Department of Agroforestry Engineering
- Computing, UC3M
- Department of Computer Science and the Applied Artificial Intelligence Group
- Field site
- Parque Agrourbano de Valdebebas, Madrid
- Catchments
- 6.1 and 8.6 ha of crops and grasslands, loamy sand, about 6% slope
- Published
- Environmental Modelling & Software 182 (2024)
The network
What the network measures
A soil moisture node every 50 metres, one level gauge at each catchment outlet, and every device reporting over NB-IoT on a duty cycle the team tunes remotely. The sheet below redraws the measurements the researchers work with, as described in their published study.
Soil moisture, twin probes
FIG. 01Each node carries two independent probes buried at 10 cm and read through an RC circuit, so every point yields a calibrated pair of records whose divergence the study itself tracks.
2 PROBES · RC CIRCUIT · 12-BIT ADC · 10-READING AVERAGE
Water level at the outlet
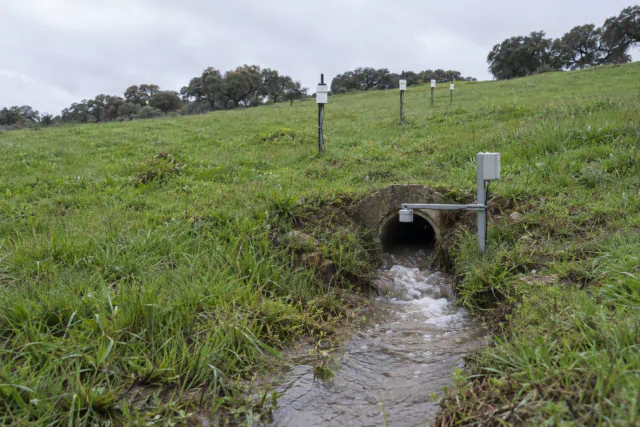
FIG. 02One ultrasonic gauge per catchment, mounted over the downstream end point, closes the water balance by watching the stage of the channel.
A02YYUW · 40 kHz · 25-30 CM TYPICAL RANGE
A field, not a point
FIG. 03Sensors on a regular 50 x 50 m grid turn point readings into a moisture map of the whole catchment through Voronoi and inverse distance interpolation.
50 x 50 M GRID · VORONOI · INVERSE SQUARED DISTANCE
A duty cycle worth days
FIG. 04Every node wakes, averages its readings, transmits and hibernates for 15 minutes. If the server cannot be reached within five minutes, it forces itself back to sleep.
NB-IOT · QUECTEL BC660K · 15 MIN CYCLE · FORCED HIBERNATION
Battery life, engineered
FIG. 05Batteries are the budget of the whole network. Tuning the operation remotely took the benchmark sensor from 4.31 to 11.24 days per charge.
3.7 V 3400 mAh · 87.7 TO 59.7 mV/DAY · CUTOFF NEAR 2700 mV
One storm, every sensor
FIG. 06Recording times are synchronized across the network from the cloud, so a single storm is captured simultaneously at every point.
REMOTE SLEEP TIME · SYNCHRONIZED SAMPLING · EVENT-BASED
Results
What the study demonstrated
The network ran through four full battery cycles in the field and came back with the answers the team was after. No sensor was lost inside its hermetic PVC capsule, and the calibration held well enough to map soil moisture across whole catchments.
The biggest gain came from the cloud: remote tuning of measurement, sleep and retry behaviour more than doubled battery life, and forced hibernation cut the cost of a bad connection.
Findings
Remote tuning, measured in the field
Battery life per charge
Discharge rate
Cost of a bad connection
Findings as published by the authors in Environmental Modelling & Software 182 (2024).
Under the hood
The cloud layer is Thinger.io
The devices are built on an IoT development toolkit manufactured by Thinger.io, an ESP32 board with a Quectel BC660K NB-IoT modem, and all of them report to the Thinger.io cloud.
Auto provisioning enrols each board on first connection, a product definition gives the fleet a shared sleep time the researchers change remotely, and one data bucket stores every reading with its battery voltage. Dashboards and the REST API feed the team's calibration curves, maps and models.
References
- Sanz, E., Trincado, J., Martínez, J., Payno, J., Morante, O., Almeida-Ñaulay, A.F., Berlanga, A., Molina, J.M., Zubelzu, S., Patricio, M.A. (2024). Cloud-based system for monitoring event-based hydrological processes based on dense sensor network and NB-IoT connectivity. Environmental Modelling & Software, 182, 106186. doi:10.1016/j.envsoft.2024.106186 (open access, CC BY).
- Bustamante, A., Patricio, M.A., Molina, J.M. (2019). Thinger.io: an open source platform for deploying data fusion applications in IoT environments. Sensors, 19(5), 1044.
Keep reading
More success stories

SeaWater Analytics: a live quality index for bathing water
Smart buoys over submarine outfalls feed a beach water quality app on the Xàbia coast.
Read the case study
Arvum: agronomy know-how delivered as a service
Growers irrigate by soil profile data, guided through AG-ZOOM, the firm's own platform.
Read the case study
MAPHI: fresh food grown in Antarctica
A hydroponic module at Marambio Base grows fresh greens at -30 °C outside.
Read the case studyNext step
Put your water network on a platform
This monitoring system runs on the same open platform any team can start with. If you want to monitor soil moisture, water levels or any hydrological process at scale, we can help you get there.